I have 'felt like' for some time now that somehow the FED is manipulating the market in such a way as to severely punish anyone who dared be 'short' their precious equity market..
I began shorting the SPY / SPX myself once it had bounced about 35% off the lows / bottom.. I was and still am staying very small because I realized going in that this was a risky, dangerous business.. Especially when it involves fighting the FED and their Primary Dealer cohorts..
So i have gradually added to my many short positions while still keeping the great majority of my cash in.. well.. cash.. and or the equivalent of such..
Once again I depended on honesty in the markets and the products offered by the banks (stupid.. I know).
My current equity short positions include SDS DXD QID SKF SRS and TZA All pretty severely underwater, as you might imagine..
My trading style is to keep my entries small, at first, and add as I feel the opportunity presents itself loosely based on percentages (ie; double up at 50% down yields a 25% decline). As long as size is small this can be kept up for a very long time and in years past the worst I have done is bailing out at break even at some point when possible.. The market moves both up and down. Or at least it USED to..
But like I was saying before i keep getting this 'feeling' that the FED and the Primary Dealers are somehow stealing my money through market churn..
So I decided to look at something.. The SPY vs the SH ETF
Here's an overview of the SPDR S&P 500 (SPY)
---
The SPDR® S&P® 500 ETF is a fund that, before expenses, generally corresponds to the price and yield performance of the S&P 500® Index (Ticker: SPTR). Our approach is designed to provide portfolios with low portfolio turnover, accurate tracking, and lower costs.
And here's an overview of the SH ETF
---
This ETF seeks a return of -100% of the return of an index (target) for a single day. Due to the compounding of daily returns, ProShares' returns over periods other than one day will likely differ in amount and possibly direction from the target return for the same period. Investors should monitor their ProShares holdings consistent with their strategies, as frequently as daily. For more on correlation, leverage and other risks, please read the prospectus.
Of course there is this note also..
"There is no guarantee any ProShares ETF will achieve its investment objective."
So, losing money and with nothing better to do I put together some charts comparing the two.. the SPY vs the (inverse performance) SH ETF (1 to 1 short of S&P 500)
The first chart below is a 5 day chart with 5 minute candles.. And you can see that it does indeed seem to track the S&P 500 quite well..

Next I looked at a 3 month chart with daily candles and once again these two ETFs, SPY & SH seem to track each other quite well.. About a 9% gain on SPY and about a 9% loss on SH

In this next chart things start to get just a little bit odd.. It's a 6 month chart with daily candles and while the SPY shows a gain of about 22.5% the SH is showing a decline of only about 17% (So actually here i was about 5.5% BETTER off than the SPY indicated I should be)

But now please take a look at a 1 year chart again with daily candles.. It shows the SPY up about 12.5% while the inverse tracking SH ETF is down 20% ! WTF?!

And it gets WORSE! Don't forget that I have been shorting periodically for over 2 years now (I actually use SDS though an ultrashort ETF). This next chart is a 3 year chart in which each candle represents a week.. You can plainly see on the chart that DURING the financial meltdown these ETFs seemed to track each other very well as I point out on the chart where the SPY is down about 45% and the SH ETF is correspondingly up very close to 45% Yet.. when we get to the end of this chart we see that something very strange has happened at some point during our journey.. Because the SPY shows a performace over this period of 0% while the SH ETF shows a LOSS of about 32% ! WTF?!?!?!?!

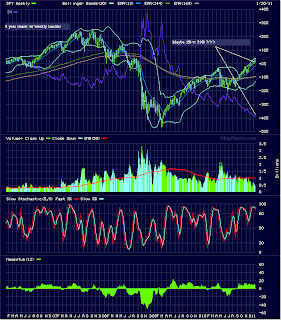
And last I want to show you a 5 year chart with weekly candles with an even larger discrepancy.. Maybe the SPY eeking out a 1% gain while the SH ETF has lost 39% of it's value over this same period..

So, apparently, the SPY has gone pretty much no where at all over the last 5 years while it's inverse tracking ETF SH has lost nearly 40% over the same period of time?! Am I just crazy on this? And.. I suspect if this 'trend' continues the banks will merely do what they have done with other short ETFs when they fall too far which is to muddy the waters even further by issuing a reverse split so they can continue the, IMHO, theft, unabated..
So who out there can help me with this? Am I just all f'ed up in my thinking? Can i not compare these in this manner? Is this not accurate? Or are my fears correct in that the Federal Reserve Bank and their Primary Dealer buddies in crime have colluded on ways to steal money from anyone who DARES be short the market?
Thanks in advance
Greg
No comments:
Post a Comment